Industries Transport & Logistics
Carbon footprint for transport and logistics: when scope 1 is most of your total
For a carrier, fuel burned in your own trucks is scope 1 and often dominates the footprint. How to measure from fuel cards and telematics, and where the levers are.

On this page
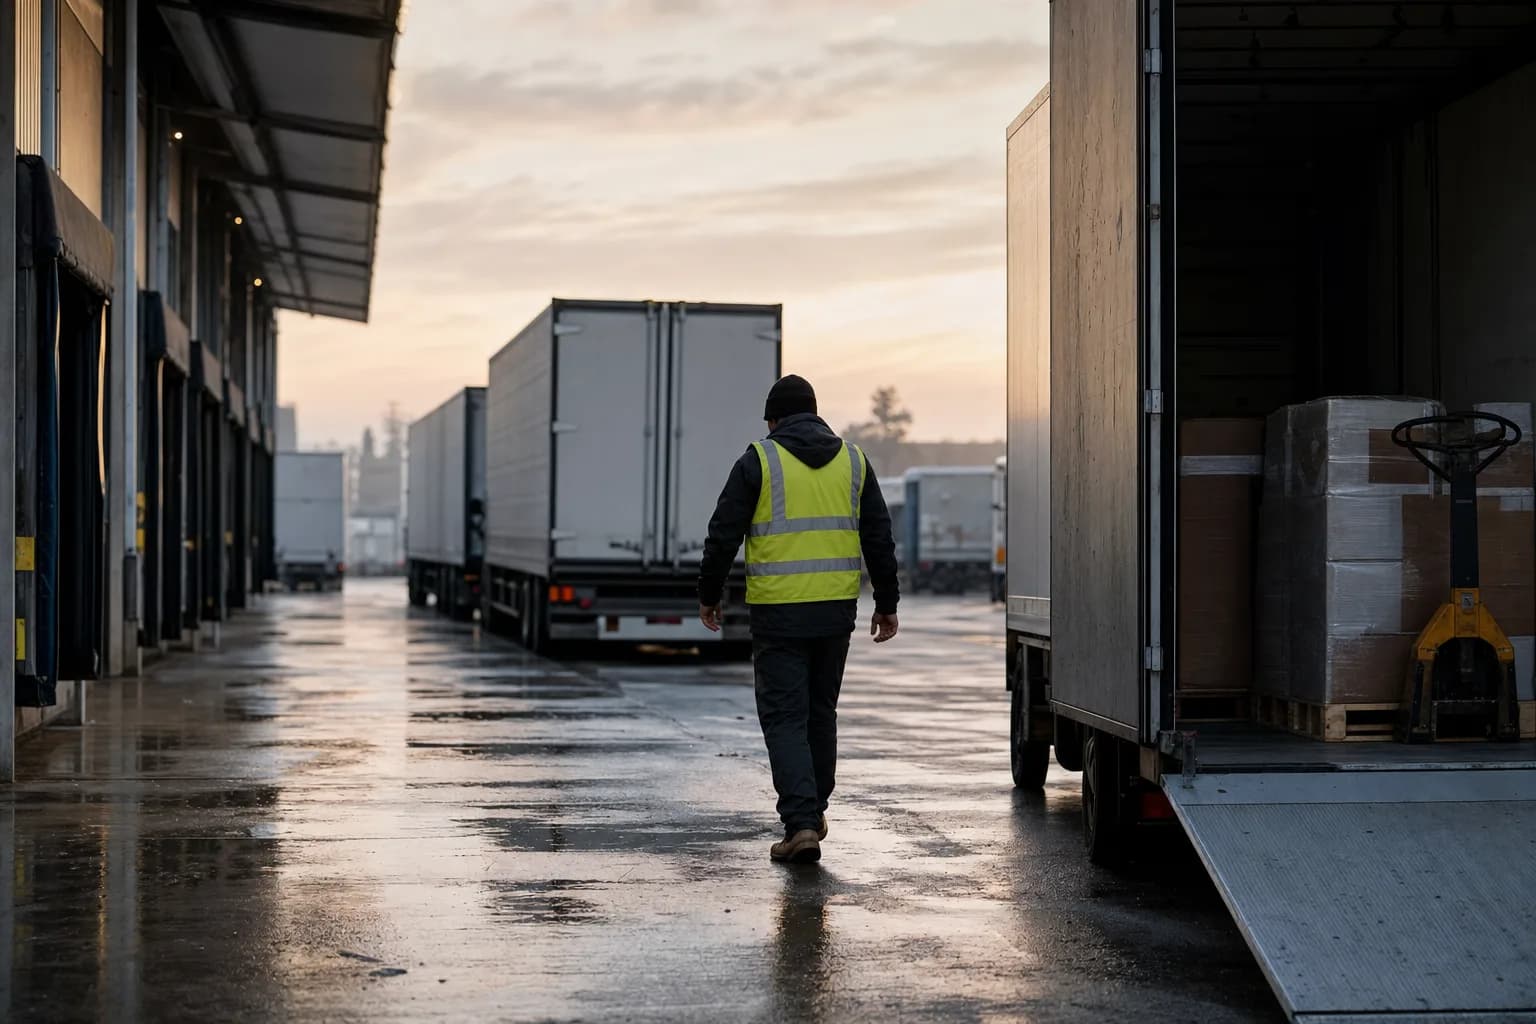
A truck running home empty burns nearly as much as a loaded one. It carried nothing, and the diesel is already on the fuel card, liter by liter, sitting in your accounting system.
That sentence contains most of what makes transport different. Other sectors carry their emissions in a scope 3 they can only estimate; a haulier owns almost all of its own outright, burned in vehicles on its own balance sheet and metered by a payment instrument. Measurement is easier here than almost anywhere in the economy. Reduction is the hard part, because the emissions are the business itself.
First, split owned from subcontracted
Before any data moves, establish which transport you operate and which you buy. Fuel in vehicles you own or lease under your operational control is scope 1, your direct emissions. Journeys you subcontract to other carriers are scope 3, and they are somebody else's scope 1.
The ratio between the two is the first structural fact about your footprint, and it decides where the effort goes. An asset-heavy carrier works on its own fleet. A commission-heavy forwarder works on carrier selection and on data quality. Getting this split backwards is the classic error of the sector, usually by counting subcontracted journeys as if they were owned, which double-counts the industry's emissions and misstates your own levers at the same time.
The fleet, at full resolution
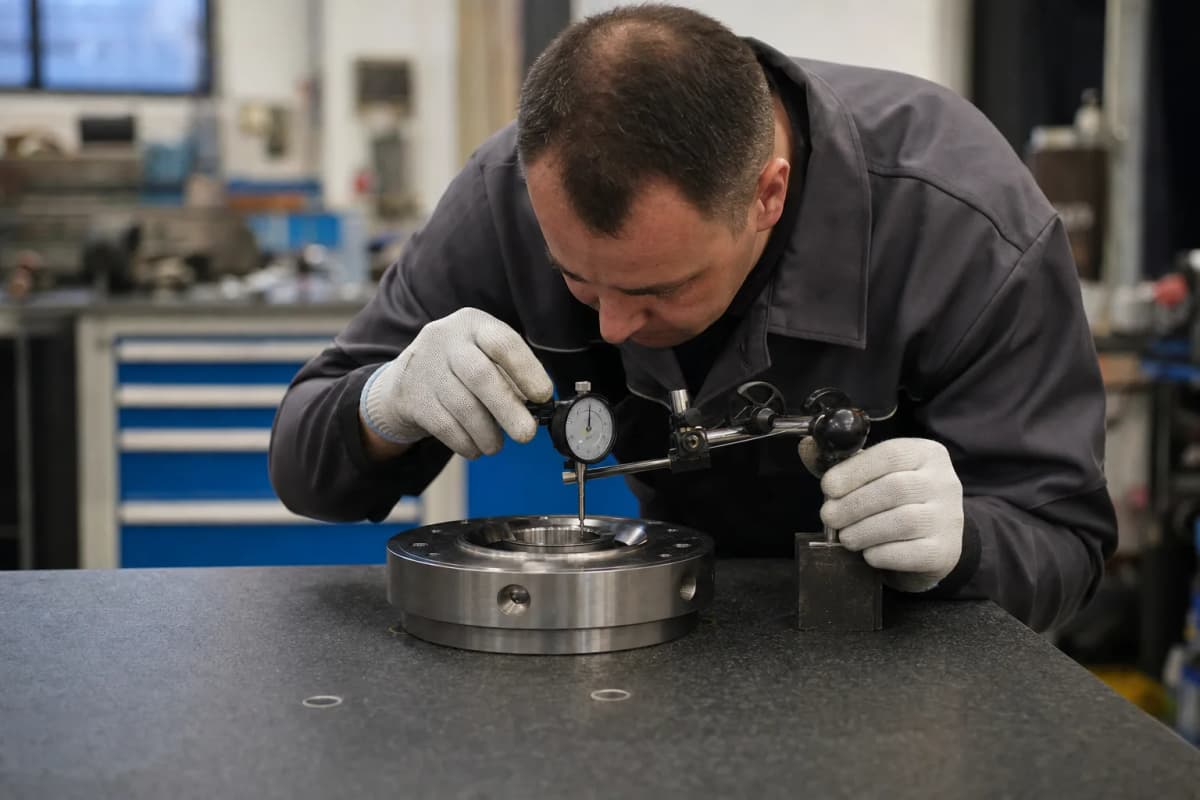
Fuel cards give liters by vehicle by month. Telematics adds kilometers, routes, idling time and driving-style indicators. Between the two you can compute emissions per vehicle, per lane, per customer, per driver cohort, a resolution other sectors would envy, and that resolution is what makes a footprint operational rather than ceremonial.
Report the total, but build the model on liters. Not on euros of fuel spend, and not on average consumption assumptions. Where gas, HVO (hydrotreated vegetable oil) or electric vehicles have entered the fleet, keep each energy as its own line with its own factor, because blending them into a fleet average hides precisely the transition you are trying to demonstrate.
Good to know: refrigerated transport carries a second scope 1 line, the leakage of refrigerant from transport cold units. The maintenance recharge records are the measurement. On a reefer-heavy fleet this line is material, and it is the one most often missed entirely.
Warehouses, and the cold that changes them
Warehouse electricity, lighting, conveyors, chargers for the forklift fleet, is scope 2 and comes off the invoices site by site.
Cold storage multiplies both stakes at once: compressors run around the clock, and industrial refrigerant circuits leak by design over time. A logistics company with significant cold volume should treat the cold chain as its own analytical block, energy plus leakage, because it behaves differently from ambient warehousing and responds to entirely different investments.
The subcontracted miles
For subcontracted transport, the honest first-year method is tonne-kilometers by mode and lane, multiplied by standard factors from ADEME's Base Empreinte. The improvement path is to replace those standard factors with carrier-specific data, which more and more carriers can produce, because they are running this same exercise on themselves.
Your buying power here is measurement power. A data clause in the transport contract costs nothing and upgrades your footprint every year it runs. Purchased vehicles and their embodied emissions, fuel production upstream of the pump, and the usual tail of services complete the scope 3 picture, all serviceable with standard factors on accounting data.
The levers were already on the whiteboard
The carbon levers in transport are the productivity levers with a new unit attached. Load factor up means emissions per tonne down. Empty kilometers eliminated are liters eliminated. Driver training on anticipation and idling, route optimization, fleet renewal toward newer Euro standards or alternative energies: every one of these was already an operations project chasing cost per kilometer, and the footprint simply prices it in CO2-equivalent as well.
So take it to your management in those terms: in this sector the carbon plan and the margin plan are mostly the same plan, and it can be funded out of the fuel line it is going to shrink. That framing also answers the shippers now asking for emissions per shipment, because their scope 3 is your scope 1.
FAQ
Is subcontracted transport scope 1 or scope 3?
Scope 3. Only fuel burned in vehicles you own or lease under your operational control is scope 1. Journeys bought from subcontracting carriers are their scope 1 and your scope 3, measured first with tonne-kilometers by mode and standard factors, then improved with each carrier's own data.
What data do you need for a transport company's carbon footprint?
Fuel card statements (liters per vehicle), telematics (kilometers, idling), refrigeration unit recharge reports, warehouse energy invoices, and for subcontracting, tonne-kilometers by lane and mode. Transport holds better activity data than most sectors, and the model should use it at full resolution.
How does a transport company reduce its carbon footprint?
Through the levers operations already tracks for cost: better load factor, fewer empty kilometers, eco-driving, route optimization, and fleet renewal toward recent standards or alternative energies such as electric or HVO. Emissions per tonne-kilometer fall as productivity per liter rises.